
ファイル:OECD Social Security Contributions.svg

この SVG ファイルのこの PNG プレビューのサイズ: 800 × 400 ピクセル. その他の解像度: 320 × 160 ピクセル | 640 × 320 ピクセル | 1,024 × 512 ピクセル | 1,280 × 640 ピクセル | 2,560 × 1,280 ピクセル | 1,440 × 720 ピクセル。
元のファイル (SVG ファイル、1,440 × 720 ピクセル、ファイルサイズ: 102キロバイト)
ウィキメディア・コモンズのファイルページにある説明を、以下に表示します。
|
概要
| 解説 |
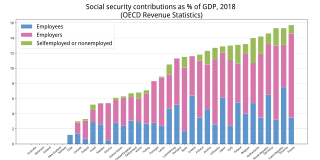
Social Security Contributions as % of GDP, 2018, OECD Revenue Statistics https://stats.oecd.org/Index.aspx?DataSetCode=REV |
| 日付 | |
| 原典 | 投稿者自身による著作物 |
| 作者 | Yuasan |
Graph data
import matplotlib.pyplot as plt
import pandas as pd

df = pd.read_csv("data.tsv", index_col=0 , sep = "\t")
df = df.sort_values(by=["Total"], ascending=True)

fig, ax = plt.subplots(figsize=(16, 8))
ax.bar(df.index, df["Employees"] , color="#5E95CD", width=0.7, bottom=0)
ax.bar(df.index, df["Employers"], color="#D676AB", width=0.7, bottom=df["Employees"] )
ax.bar(df.index, df["Selfemployed or nonemployed"], color="#9BBB59", width=0.7 , bottom=df["Employees"]+df["Employers"] )

ax.legend(df.columns, fontsize=20,  loc='upper left',)
ax.set_axisbelow(True)

plt.rcParams['font.family'] = 'sans-serif'
plt.rcParams['font.sans-serif'] = ['Noto Sans Display']
plt.subplots_adjust(left=0.05, bottom=0.1, right=0.96, top=0.9)

plt.title("Social security contributions as % of GDP, 2018 \n(OECD Revenue Statistics)", fontsize=26)
plt.tick_params(labelsize=10, pad=4)
plt.xticks(rotation=40)
plt.yticks(fontsize=13)
plt.grid(which='major',color='#cccccc',linestyle='-', axis="y")
plt.subplots_adjust(top =0.88)

plt.savefig("image.svg")
ライセンス
この作品の著作権者である私は、この作品を以下のライセンスで提供します。
| このファイルはクリエイティブ・コモンズ CC0 1.0 全世界 パブリック・ドメイン提供のもとで利用可能にされています。 | |
| ある作品に本コモンズ証を関連づけた者は、その作品について世界全地域において著作権法上認められる、その者が持つすべての権利(その作品に関する権利や隣接する権利を含む。)を、法令上認められる最大限の範囲で放棄して、パブリック・ドメインに提供しています。
この作品は、たとえ営利目的であっても、許可を得ずに複製、改変・翻案、配布、上演・演奏することが出来ます。 |
ファイルの履歴
過去の版のファイルを表示するには、その版の日時をクリックしてください。
| 日付と時刻 | サムネイル | 寸法 | 利用者 | コメント | |
|---|---|---|---|---|---|
| 現在の版 | 2021年6月26日 (土) 12:51 | | 1,440 × 720 (102キロバイト) | Yuasan | 2018 data |
| 2016年12月12日 (月) 07:58 |  | 747 × 429 (135キロバイト) | Yuasan | User created page with UploadWizard |
ファイルの使用状況
以下のページがこのファイルを使用しています:
グローバルなファイル使用状況
以下に挙げる他のウィキがこの画像を使っています:
- en.wikipedia.org での使用状況