
ファイル:Five Myr Climate Change.svg

元のファイル (SVG ファイル、1,024 × 372 ピクセル、ファイルサイズ: 68キロバイト)
ウィキメディア・コモンズのファイルページにある説明を、以下に表示します。
|
概要
| 解説 |
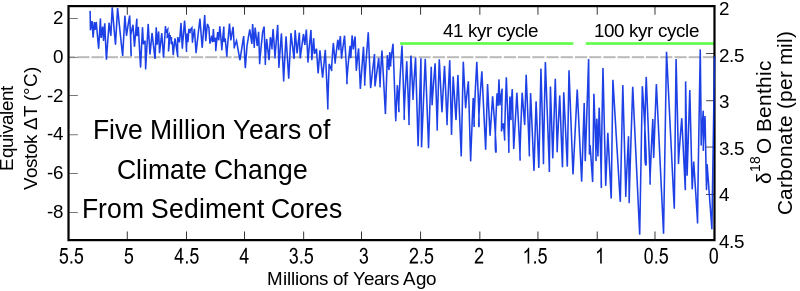
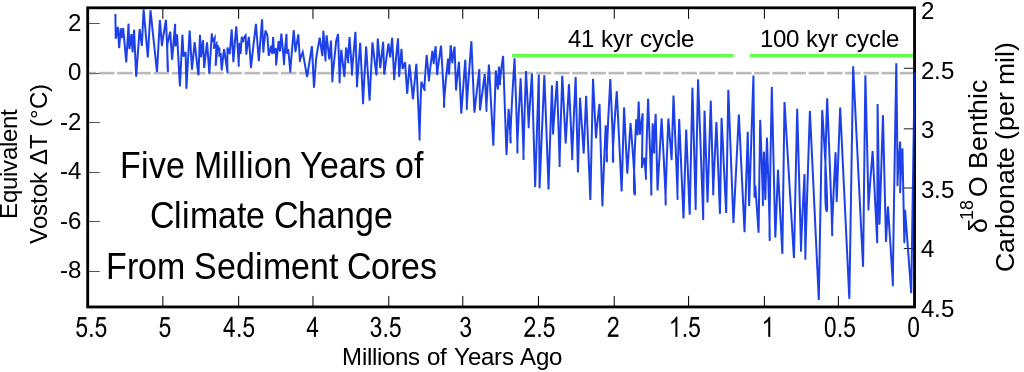
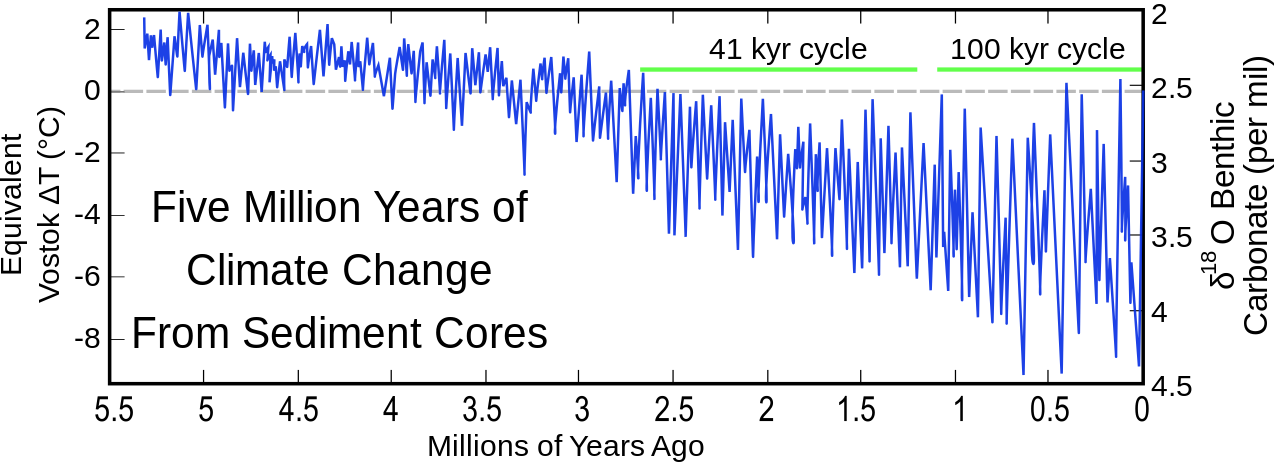
reconstruction of the past 5 million years of climate history, based on oxygen isotope fractionation (serving as a proxy for the total global mass of glacial ice sheets). See the discussion below for a summary of the methods and models used. Català: Reconstrucció dels darrers cinc milions d'anys de la història del clima, basada en el fraccionament d'isòtops d'oxigen (que serveix com a proxy de la massa global total de les capes de gel glacials). Русский: Реконструкция истории климата за последние пять миллионов лет на основе значений δ18O. Эта величина, производная от отношения изотов кислорода 18O и 16O (см. δ18O (en)), выступает в роли заменителя (прокси) глобальной температуры.
Note that the resolution of the graph has suffered in the conversion from png to svg. Use the original png if possible. Also note that in 2010, User:SeL media switched the orientation of the time axis and the vertical axes, apparently without discussion, and some descriptions of the image may refer to the older version, resulting in confusion of 'right' and 'left' in the image. |
| 日付 | (svg file 2009-02-07) |
| 原典 | svg-version of Five_Myr_Climate_Change.png; original image by User:Dragons flight, based on data (figure 4?) from Lisiecki and Raymo (2005) |
| 作者 | Dragons flight (Robert A. Rohde), svg by Jo |
| 許可 (ファイルの再利用) |
This figure was prepared by Robert A. Rohde based on published data and is incorporated into the Global Warming Art project. |
| その他のバージョン |
Five_Myr_Climate_Change.png, このファイルの派生的著作物: Five Myr Climate Change-ml.svg, Five Myr Climate Change (de), Five Myr Climate Change (fr) File:Five Myr Climate Change.svg has 3 translations.
|


.svg)
.svg)
Discussion


This figure shows the climate record of Lisiecki and Raymo (2005) [1] constructed by combining measurements from 57 globally distributed deep sea sediment cores. The measured quantity is oxygen isotope fractionation (δ18O) in benthic foraminifera, which serves as a proxy for the total global mass of glacial ice sheets.
Lisiecki and Raymo constructed this record by first applying a computer aided process of adjusting individual "wiggles" in each sediment core to have the same alignment (i.e. wiggle matching). Then the resulting stacked record is orbitally tuned by adjusting the positions of peaks and valleys to fall at times consistent with an orbitally driven ice model (see: Milankovitch cycles). Both sets of these adjustments are constrained to be within known uncertainties on sedimentation rates and consistent with independently dated tie points (if any). Constructions of this kind are common, however they presume that ice sheets are orbitally driven, and hence data such as this can not be used in establishing the existence of such a relationship.
The observed isotope variations are very similar in shape to the temperature variations recorded at Vostok, Antarctica during the 420 kyr for which that record exists. Hence the right hand scale of the figure was established by fitting the reported temperature variations at Vostok (Petit et al. 1999) to the observed isotope variations. Hence, this temperature scale should be regarded as approximate and its magnitude is only representative of Vostok changes. In particular, temperature changes at polar sites, such as Vostok, frequently exceed the changes observed in the tropics or in the global average. A horizontal line at 0 °C indicates modern temperatures (circa 1950).
Labels are added to indicate regions where 100 kyr and 41 kyr cyclicity is observed. These periodicities match periodic changes in Earth's orbital eccentricity and obliquity respectively, and have been previously established by other studies (not relying on orbital tuning). For discussion of how such orbital changes might drive climate change, see Milankovitch cycles.
References
- Lisiecki, L. E., and M. E. Raymo (2005), A Pliocene-Pleistocene stack of 57 globally distributed benthic δ18O records, Paleoceanography, 20, PA1003, doi:10.1029/2004PA001071; data: doi:10.1594/PANGAEA.704257. — bundled as {{cite DOI|10.1029/2004PA001071}}
- Petit J.R., Jouzel J., Raynaud D., Barkov N.I., Barnola J.M., Basile I., Bender M., Chappellaz J., Davis J., Delaygue G., Delmotte M., Kotlyakov V.M., Legrand M., Lipenkov V., Lorius C., Pépin L., Ritz C., Saltzman E., Stievenard M. (1999) Climate and Atmospheric History of the Past 420,000 years from the Vostok Ice Core, Antarctica, Nature, 399, pp.429-436, doi:10.1038/20859.
ライセンス

|
この文書は、フリーソフトウェア財団発行のGNUフリー文書利用許諾書 (GNU Free Documentation License) 1.2またはそれ以降のバージョンの規約に基づき、複製や再配布、改変が許可されます。不可変更部分、表紙、背表紙はありません。このライセンスの複製は、GNUフリー文書利用許諾書という章に含まれています。 |
| このファイルはクリエイティブ・コモンズ 表示-継承 3.0 非移植ライセンスのもとに利用を許諾されています。 | ||
| ||
| このライセンスのテンプレートは、GFDLのライセンス・アップデートによりこのファイルに追加されたものです。 |
| Dragons flight's Temperature Record Series |
| This figure is part of a series of plots created by Dragons flight to illustrate changes in Earth's temperature and climate across many different time scales. |
| Time Period: 25 yrs | 150 yrs | 1 kyr | 2 kyr | 12 kyr | 450 kyr | 5 Myr | 65 Myr | 500 Myr |
| For articles related to this topic see: Temperature record |
ファイルの履歴
過去の版のファイルを表示するには、その版の日時をクリックしてください。
| 日付と時刻 | サムネイル | 寸法 | 利用者 | コメント | |
|---|---|---|---|---|---|
| 現在の版 | 2024年1月6日 (土) 20:06 | 1,024 × 372 (68キロバイト) | Ivsetaki | Added a Russian translation. | |
| 2023年10月4日 (水) 14:58 | 1,024 × 372 (61キロバイト) | EnjolrasXXI | File uploaded using svgtranslate tool (https://svgtranslate.toolforge.org/). Added translation for ca. | ||
| 2010年7月18日 (日) 13:45 | 1,024 × 372 (55キロバイト) | SeL media | time axis reversed | ||
| 2009年2月7日 (土) 22:16 | 1,024 × 372 (51キロバイト) | Jo Weber | some minor fixes | ||
| 2009年2月7日 (土) 21:42 | 1,025 × 393 (50キロバイト) | Jo Weber | Changed text to path | ||
| 2009年2月7日 (土) 21:39 | 1,025 × 393 (32キロバイト) | Jo Weber | {{Information |Description=svg-version of Five_Myr_Climate_Change.png |Source=see below |Date=2009-02-07 |Author=Dragons flight, svg by Jo |Permission=see below |other_version |
ファイルの使用状況
以下のページがこのファイルを使用しています:
グローバルなファイル使用状況
以下に挙げる他のウィキがこの画像を使っています:
- azb.wikipedia.org での使用状況
- bg.wikipedia.org での使用状況
- bn.wikipedia.org での使用状況
- ca.wikipedia.org での使用状況
- cs.wikipedia.org での使用状況
- en.wikipedia.org での使用状況
- Ice age
- Stone Age
- Climate of Antarctica
- Milankovitch cycles
- Marine isotope stages
- Environmental isotopes
- Marine Isotope Stage 11
- Marine Isotope Stage 5
- User:Mark Buchanan/sandbox/Glaciation-WIP
- Marine Isotope Stage 13
- User:Dtolson1/sandbox
- User:Klakhani1118/sandbox
- Mid-Pleistocene Transition
- Don Glaciation
- User:Scienceislife22/Marine Isotope Stage 9
- en.wikibooks.org での使用状況
- en.wikiversity.org での使用状況
- es.wikipedia.org での使用状況
- fa.wikipedia.org での使用状況
- he.wikipedia.org での使用状況
- it.wikipedia.org での使用状況
- mk.wikipedia.org での使用状況
- ms.wikipedia.org での使用状況
- no.wikipedia.org での使用状況
- pl.wikipedia.org での使用状況
- pt.wikipedia.org での使用状況
- ru.wikipedia.org での使用状況
- sl.wikipedia.org での使用状況
- sv.wikipedia.org での使用状況
- te.wikipedia.org での使用状況
- tg.wikipedia.org での使用状況
このファイルのグローバル使用状況を表示する。